How to use NSW Niche Finder
Who should use this website?
This website will be of use to people interested in improving their understanding of the plant species of NSW, including managers and bush regenerators.
Click on the links below to guide you on how to use this website:
How to map occurrence data and graph niche metrics of NSW plant species
How to map occurrence data and graph niche metrics of NSW plant species
As an example, we would like to view a distribution map of Acacia linifolia and its occurrences in relation to altitude and certain environmental variables.
1. Click on the Species icon on the home page
2. Begin typing the name of the species until a drop down box of names appears, including Acacia linifolia.
Click on the species name in the drop down box. Alternatively, search for the species by clicking on the
List all families,
List all genera or List all species options
3. The species' profile page appears in a new window with a distribution map (occurrences: red dots are NSW and blue dots are non-NSW) and range metrics (size and dimensions) (Figure 1).
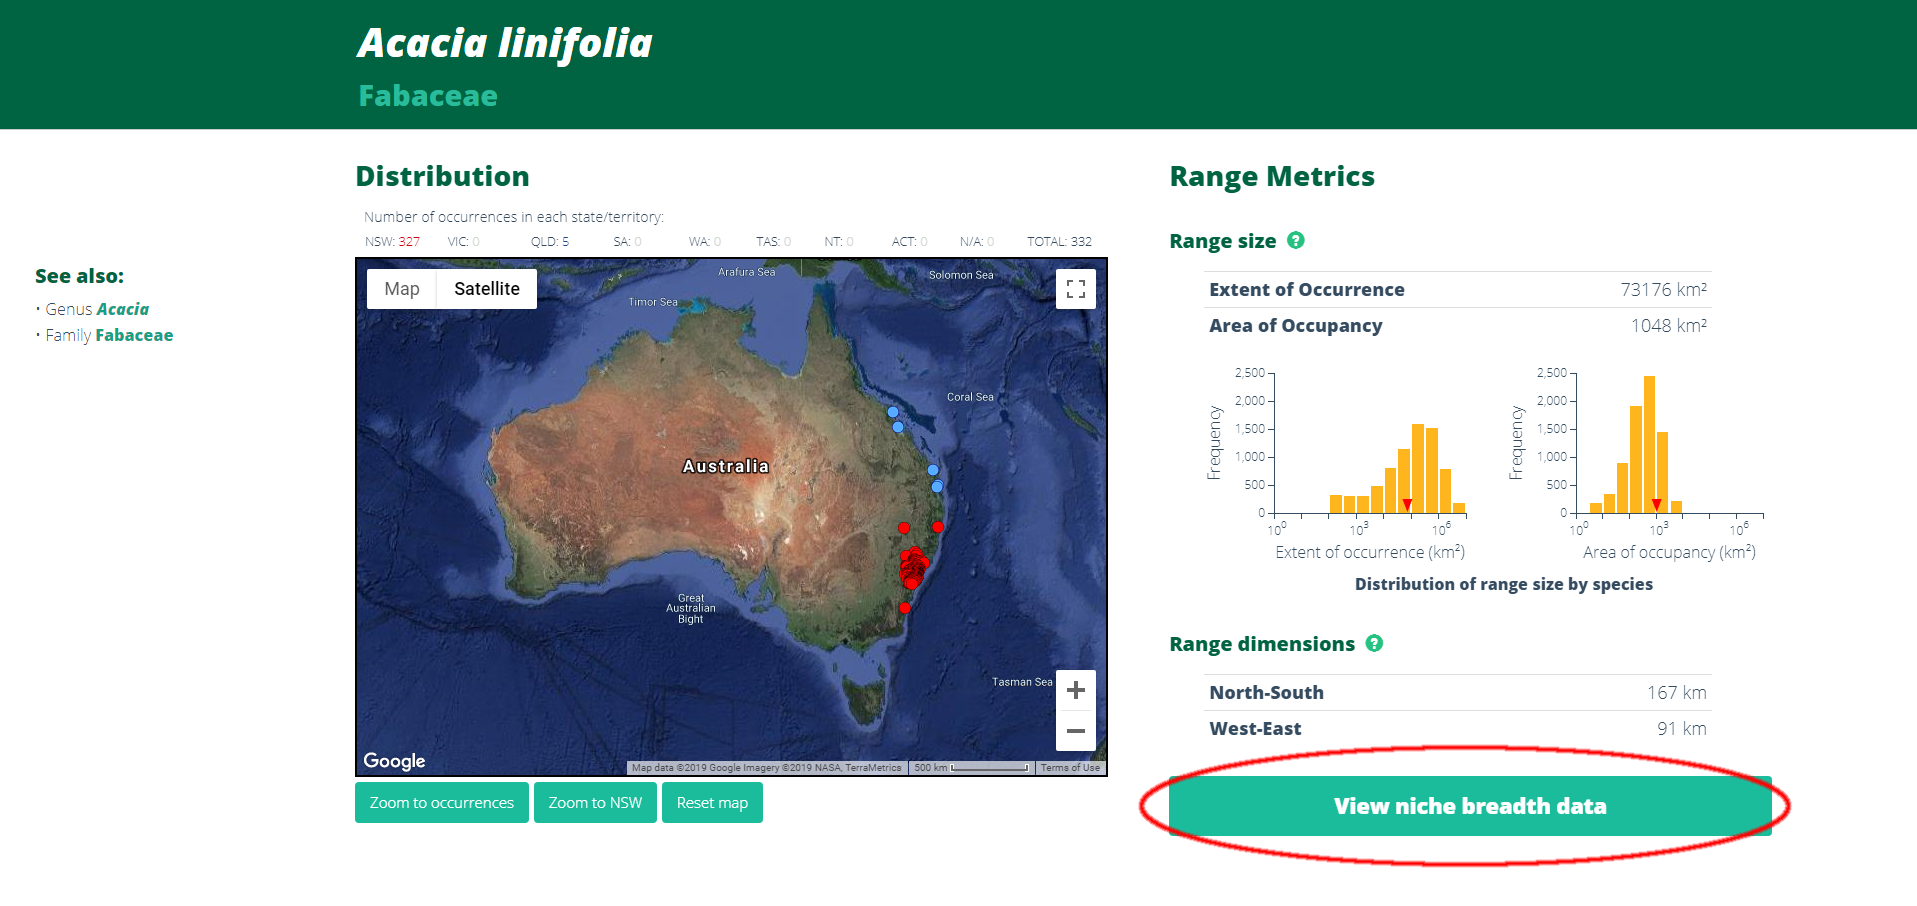
Figure 1. Profile page for Acacia linifolia
4. To view additional niche metrics (altitude, soil and climate) for the species, click on the View niche breadth data tab at the bottom of the web page (circled in red, Figure 1).
5. Click on a metric, e.g. altitude (Figure 2)
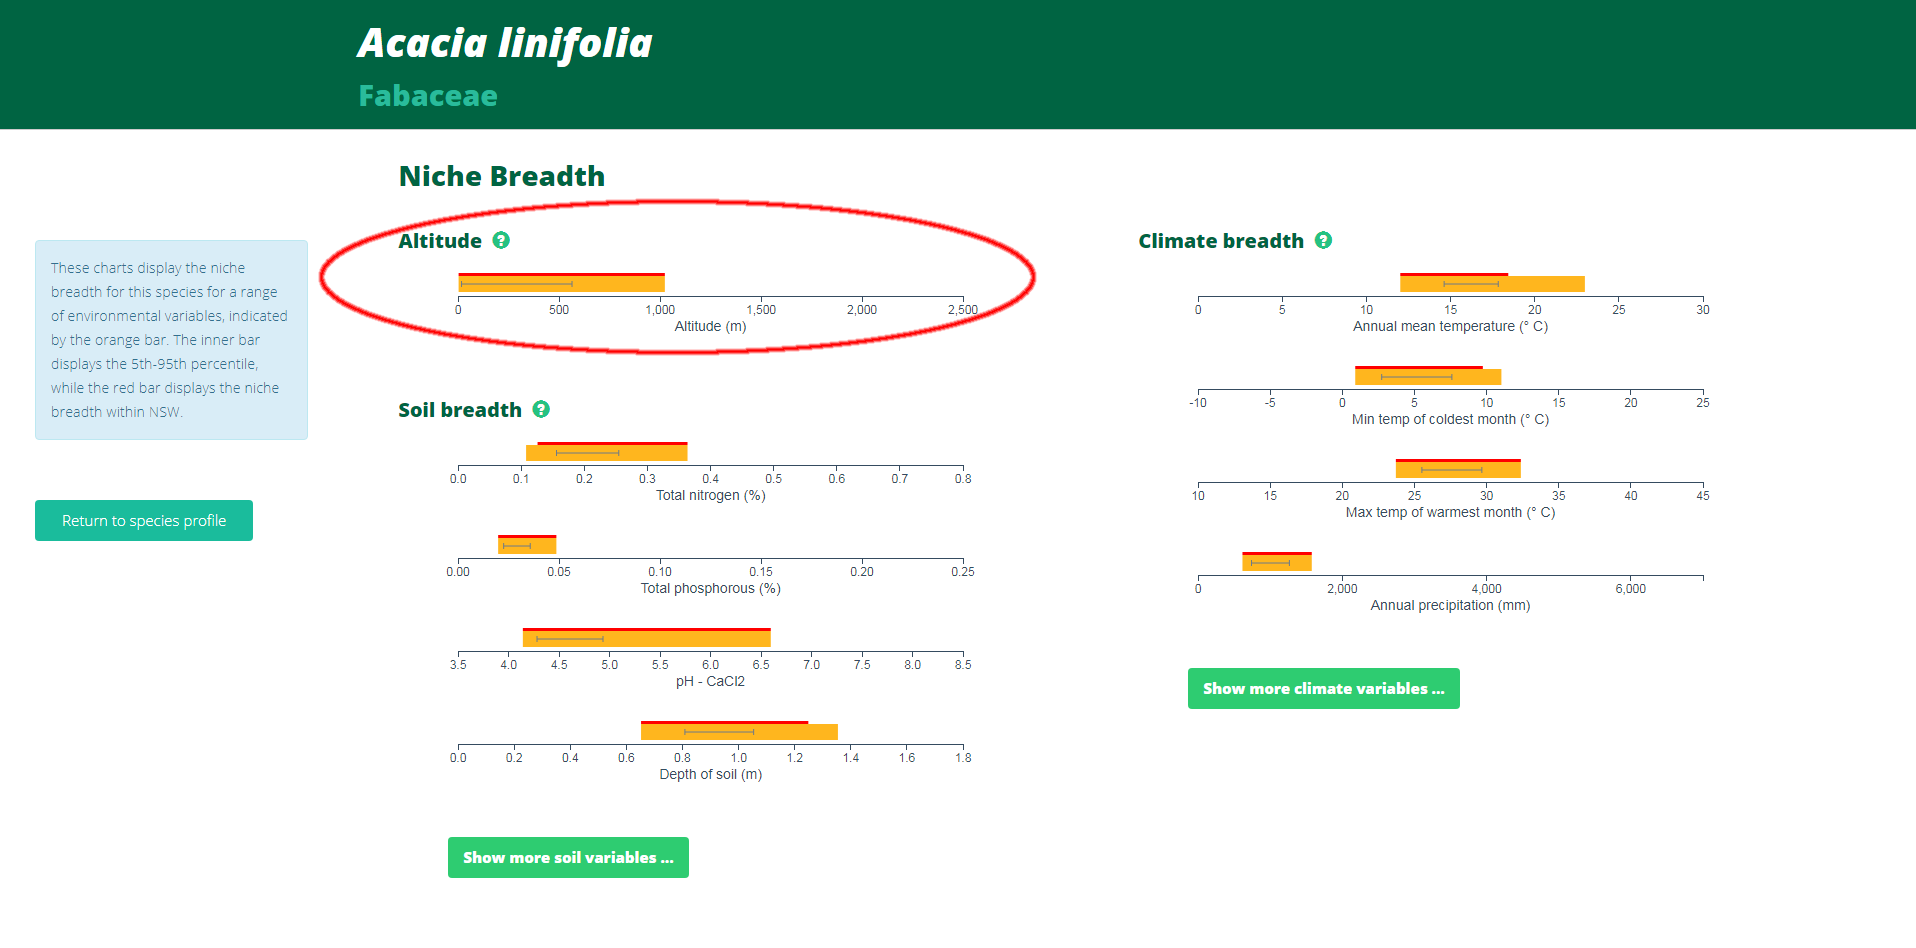
Figure 2. A selection of niche metrics, with altitude selected
... and a bar chart appears on the next page (Figure 3).
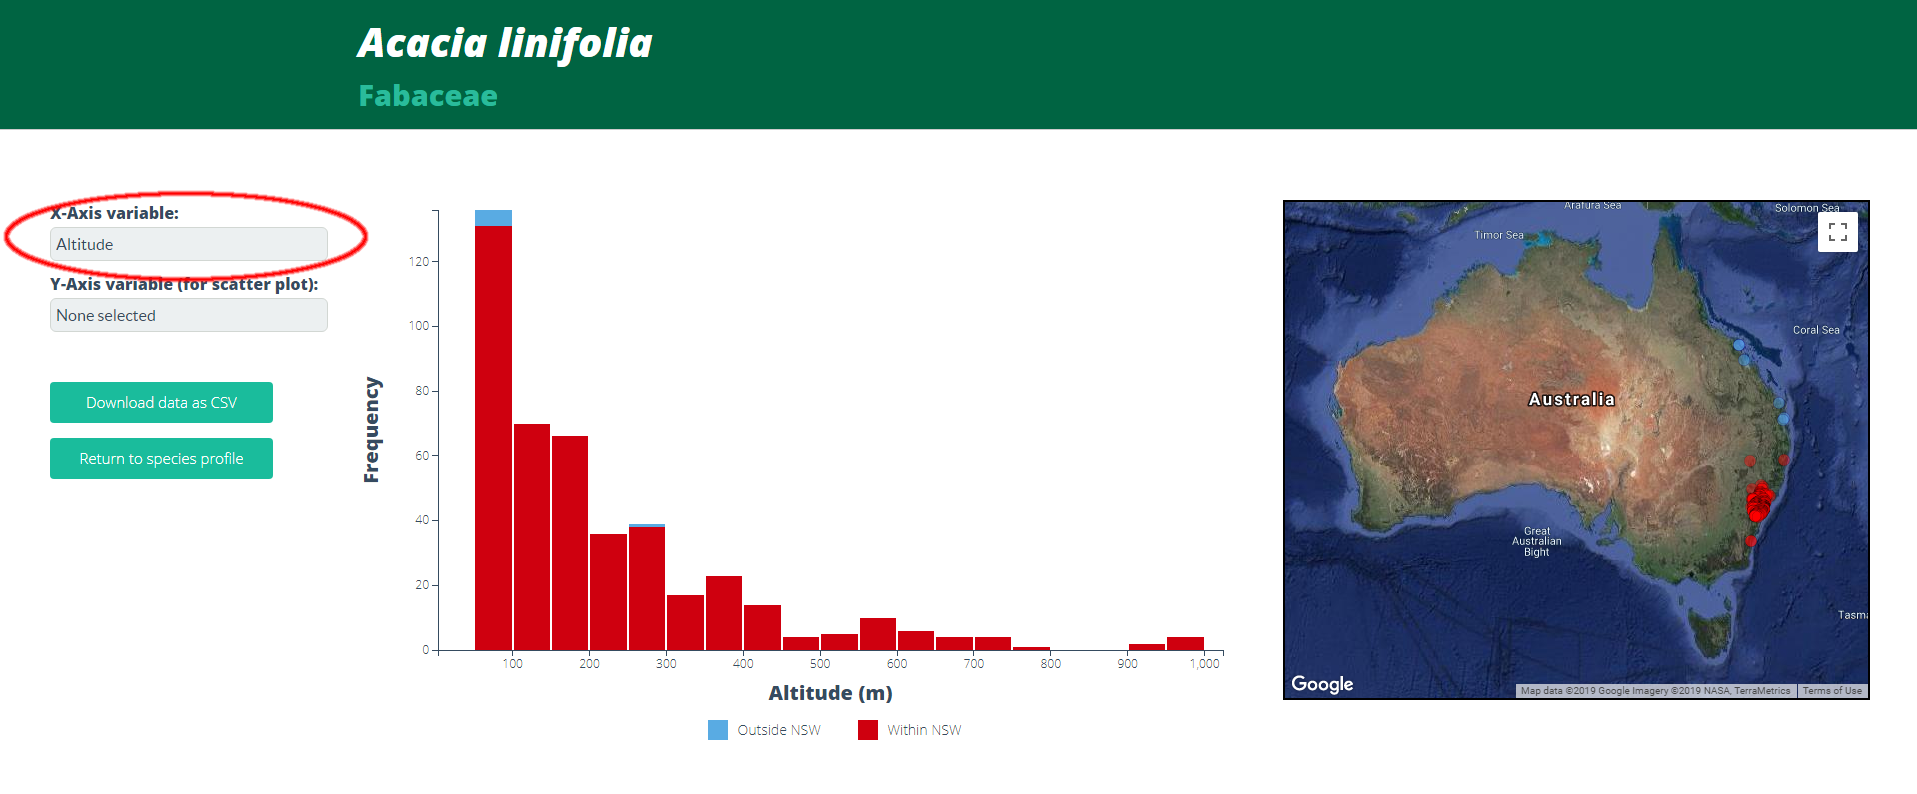
Figure 3. Bar graph of the number of Acacia linifolia occurrence records (frequency: y axis) recorded against altitude (x axis)
6. To view other attributes as a bar graph, select another metric from the drop down box, circled in red in Figure 3. Hover over any part of the graph to see the corresponding locations on the map in yellow.
7. To view two metrics simultaneously, e.g., to view a climate envelope for the species, select a metric for the x axis (e.g., annual mean temperature) and another metric from the drop down box for the y axis (e.g., annual precipitation) (Figure 4).
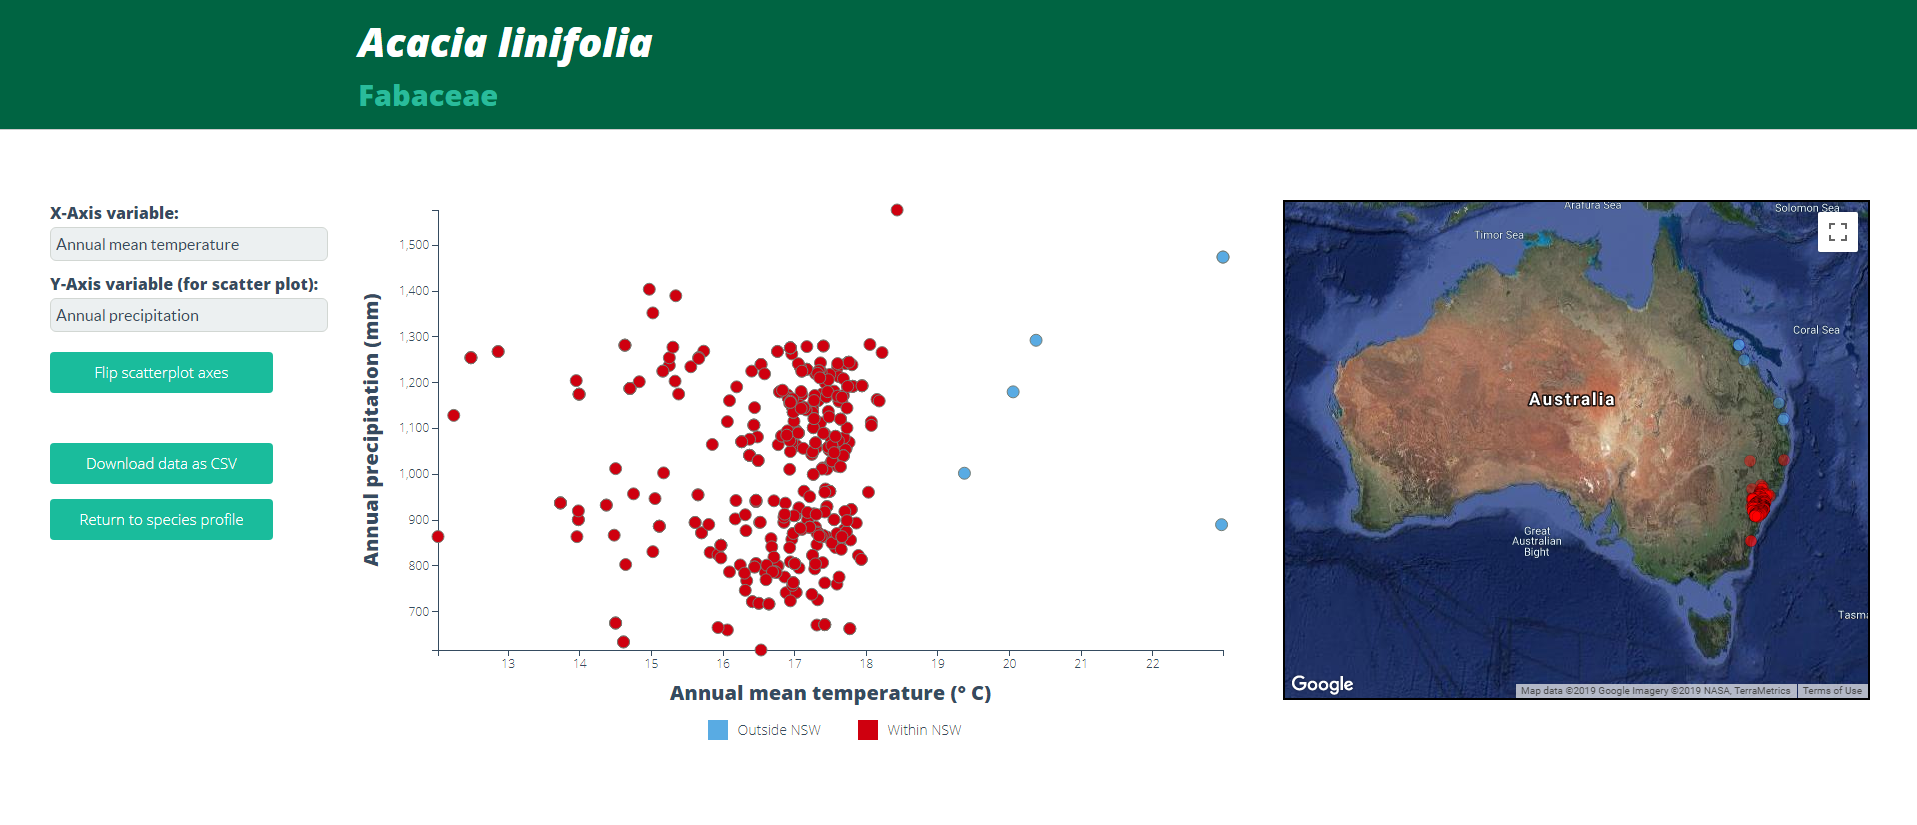
Figure 4. Climate envelope for Acacia linifolia (annual mean temperature and annual precipitation)
How to obtain a plant species list by region
As an example, we would like to view a list of species that occur in the Hunter Local Land Services region. The types of regions available to select from are CAPAD, IBRA, LLS and LGA.
1. Click on the Regions icon on the home page
2. Begin typing the name of the region until a drop down box of names appears, including Hunter LLS. Click on the name that appears in the drop down box and a list of species that occur in that region appears (Figure 5). The Extent of Occurrences and Area of Occupancy figures for the species are included on the page. The lists can be resorted by clicking on the arrow in the heading column. Click on the species' name to view the species' profile page.
Note: Not all species that occur in the location of interest will be listed. See the methods section for information on how the data was compiled.
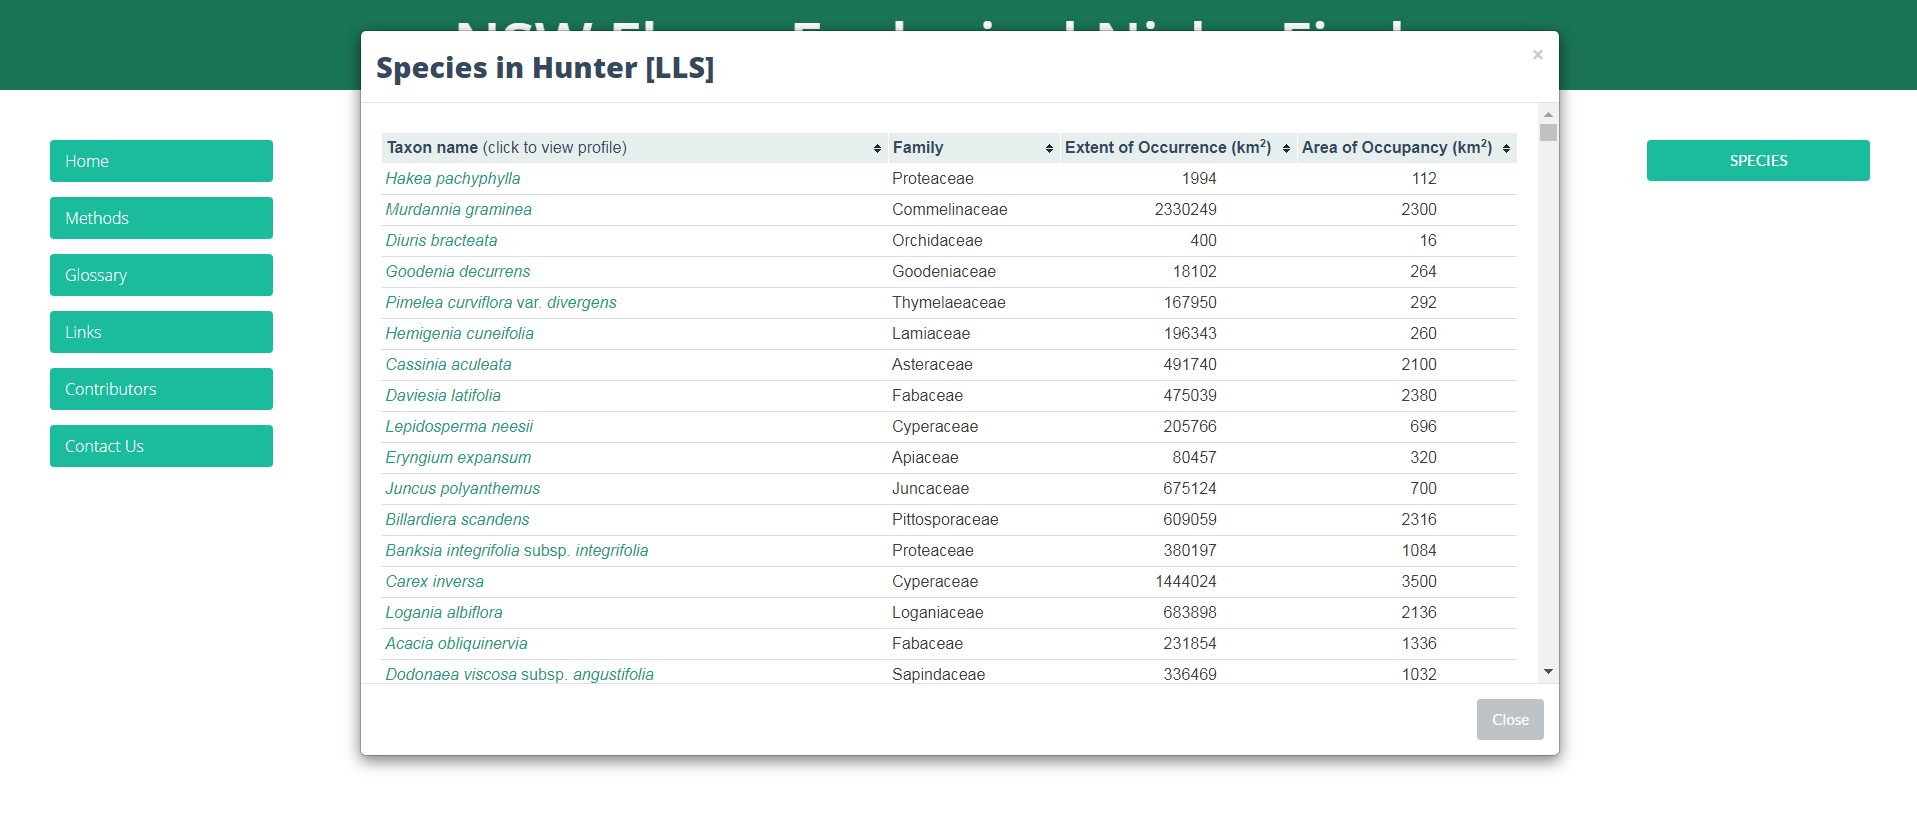
Figure 5. Species list for the Hunter LLS region